Choosing among China best inverters requires more than comparing a single efficiency percentage. In real installations, performance changes with load, temperature, battery voltage, cable length, and power quality. What affects the efficiency of an inverter becomes clearer when these conditions are measured together.
A well-designed inverter may reach over 95% peak efficiency under laboratory conditions. However, a household rarely operates at that exact point. A refrigerator starts suddenly, solar input fluctuates, and nighttime loads may remain very low. At 20% load, standby consumption can noticeably reduce daily energy savings. Heat also matters. A unit installed inside a hot, poorly ventilated cabinet may reduce output or activate protective cooling. Small details count.
Field testing should include input voltage, output power, ambient temperature, and conversion losses. Certified products should provide reliable technical data and comply with recognized safety requirements, such as IEC standards where applicable. Experienced installers also check terminal tightness, cable sizing, grounding, and ventilation before judging performance. These practical checks often reveal problems that a product brochure cannot show.
A neat specification sheet can still mislead. Peak efficiency is not the same as seasonal efficiency. That distinction deserves attention. Comparing efficiency curves, warranty terms, monitoring functions, and after-sales support gives buyers a more realistic view of value. The strongest choice is not always the model with the highest advertised number. It is the inverter that maintains stable, safe performance under the actual conditions of the installation.
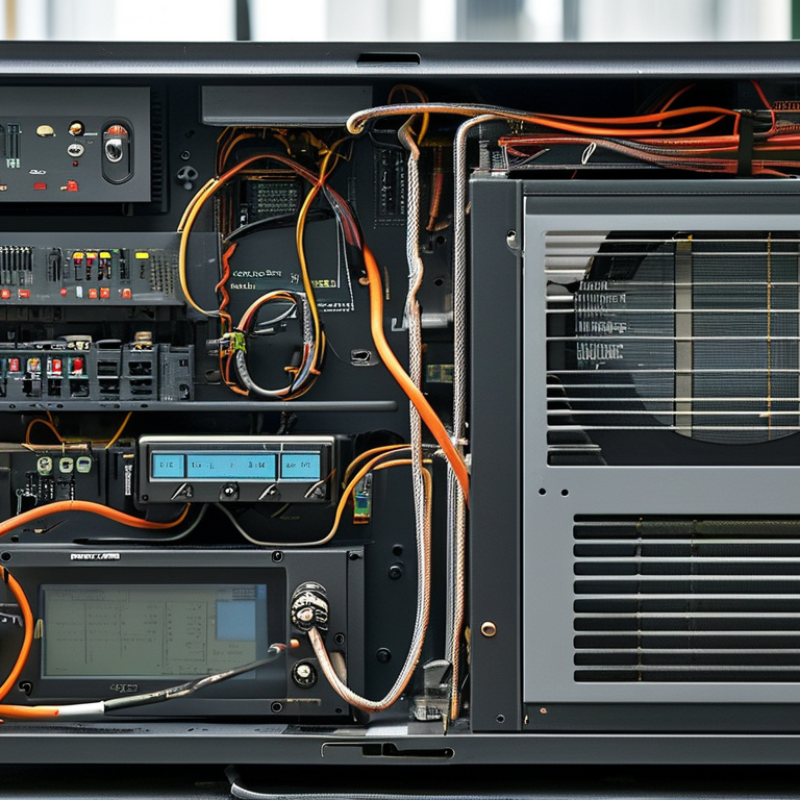
What Inverter Efficiency Means and Why It Matters
Inverter efficiency is the percentage of direct-current electricity converted into usable alternating current. A 96% efficient inverter turns 10 kWh of solar power into about 9.6 kWh. The remaining energy becomes heat. The difference seems small, but it grows across thousands of operating hours. NREL’s PVWatts documentation uses 96% as a practical default for inverter efficiency. Fraunhofer ISE’s Photovoltaics Report shows that advanced inverters can reach above 98% peak efficiency. However, peak figures rarely represent a complete day.
Real performance changes with load, temperature, wiring, and battery operation. A lightly loaded inverter may perform below its headline rating. High temperatures can increase cooling demand and electrical losses. Oversized solar arrays may also cause clipping during bright midday periods. That energy is not converted. A 98% label can mislead. Field conditions are messier than laboratory testing. IEC 61683 measurement methods improve consistency, yet they cannot remove every installation variable.
Tips: Compare European or weighted efficiency, not peak efficiency alone. Check the manufacturer’s efficiency curve at 10%, 50%, and 100% load. Leave space around the inverter for ventilation. Keep cable runs short and correctly sized. Review annual energy losses, not just the purchase price. I have seen designs chase a one-percent rating improvement while ignoring shade, dust, and poor airflow. Those practical losses can matter more.
| Efficiency Dimension | What It Means | Typical Real-World Data | Effect on Performance | Why It Matters |
|---|---|---|---|---|
| Peak conversion efficiency | The highest percentage of DC input power converted into usable AC output power under specified operating conditions. | Approximately 95%–99% for modern grid-connected power inverters. | A 98% efficient inverter loses about 2% of input power as heat. | Higher efficiency increases energy yield and reduces cooling requirements. |
| Weighted or operating efficiency | Efficiency averaged across several output-load levels rather than measured only at the ideal peak point. | Typically about 96%–98.5% for well-designed grid-connected units, depending on the test method. | It better represents daily performance because inverters rarely operate at peak output continuously. | More useful than peak efficiency when comparing expected annual energy production. |
| Load level | The ratio of actual output power to the inverter's rated output power. | Efficiency is commonly lower below approximately 10%–20% load and improves near the middle-to-high operating range. | Fixed losses such as control electronics and magnetics become a larger percentage of total power at light loads. | Correctly sizing the inverter helps it operate closer to its efficient range. |
| Maximum power point tracking (MPPT) | The inverter's ability to keep a photovoltaic array operating near its maximum available power point. | Modern MPPT circuits commonly achieve approximately 98%–99.9% tracking efficiency under stable conditions. | Poor tracking can reduce harvested DC energy even when the inverter's conversion efficiency is high. | Important for systems affected by shading, different roof orientations, or rapidly changing irradiance. |
| Input voltage and DC operating range | The voltage range in which the inverter can start, track power, and operate efficiently. | Many string inverters use high-voltage DC inputs, often with MPPT windows spanning several hundred volts; exact ranges vary by design. | Operation near the edge of the permissible voltage range may reduce performance or cause shutdowns. | Proper string design improves energy capture and helps avoid unsafe or inefficient operating conditions. |
| Temperature | Ambient temperature and internal component temperature during operation. | Many inverters begin thermal derating at elevated temperatures, commonly around 45°C–60°C ambient or internal operating conditions, depending on the model. | Heat increases electrical losses and may limit output power to protect semiconductor components. | Good ventilation, shade, and correct installation spacing help maintain efficiency. |
| Power factor | The relationship between real power delivered and apparent power carried by the AC system. | Modern grid-connected inverters are often capable of operating close to unity power factor, such as 0.99, subject to settings and grid requirements. | A lower power factor increases current for the same useful power and can increase system losses. | Good power-factor control supports grid compatibility and reduces unnecessary AC-side loading. |
| Standby and night-time consumption | Power consumed by monitoring, communication, control, and protection circuits when useful output is low or unavailable. | Typically ranges from a few watts to several tens of watts, depending on operating mode and connected accessories. | Small continuous losses can become significant over long periods with little or no generation. | Low standby consumption improves daily and annual net energy yield. |
| Cooling and thermal design | The use of natural convection, heat sinks, or fans to remove heat generated during power conversion. | Natural cooling can reduce auxiliary consumption; fan-cooled designs may provide higher continuous power in demanding environments. | Insufficient heat removal increases internal temperature, losses, noise, and the risk of thermal derating. | Thermal design affects both efficiency and long-term reliability. |
| Conversion topology | The internal electrical architecture, such as transformerless, isolated, single-stage, or multi-stage conversion. | Transformerless designs generally have lower conversion losses than comparable transformer-based designs, while isolation may be required for specific applications. | Each additional conversion stage introduces switching and conduction losses. | Topology should be selected together with safety, isolation, grid, and application requirements. |
| Switching and semiconductor losses | Energy lost when power semiconductor devices turn on, turn off, and conduct current. | Losses depend on switching frequency, current, voltage, device technology, and thermal conditions. | Higher current and switching activity generally increase heat generation and reduce conversion efficiency. | Efficient switching design can improve output performance while controlling heat and component stress. |
| AC and DC wiring losses | Power lost in cables, connectors, fuses, disconnects, and other components outside the inverter's internal conversion circuit. | Well-designed installations commonly target low voltage drop, often around 1%–3% per circuit, subject to local design rules. | Long cable runs, undersized conductors, loose connections, and high current increase resistive losses. | Total system efficiency is always lower than the inverter's nameplate efficiency if installation losses are included. |
| Power quality and harmonic distortion | The cleanliness of the AC waveform, commonly assessed using total harmonic distortion (THD). | Grid-connected inverters are commonly designed to keep current THD below approximately 3%–5% under rated conditions, depending on applicable requirements. | Higher distortion can increase heating and losses in connected equipment and electrical infrastructure. | Good waveform quality improves compatibility, reliability, and overall system performance. |
| Battery charging and discharging efficiency | The efficiency of converting AC to DC during charging and DC to AC during discharge in energy-storage systems. | Round-trip efficiency for a complete battery storage path is commonly about 80%–95%, depending on battery chemistry, power level, temperature, and conversion stages. | Every conversion stage and battery loss reduces the energy available for later use. | Round-trip efficiency is more meaningful than inverter-only efficiency for storage applications. |
| Efficiency calculation | The basic measure of how much input power becomes useful output power. | Efficiency (%) = AC output power ÷ DC input power × 100 | For example, 9.8 kW AC from 10 kW DC equals 98% conversion efficiency. | Using the same test conditions is essential when comparing different inverter specifications. |
| Note: The figures shown are typical engineering ranges for general comparison. Actual efficiency depends on inverter design, load profile, temperature, input voltage, installation conditions, grid requirements, and the measurement standard used. | ||||
: It converts direct-current electricity into grid-compatible alternating current. Switching devices reshape the current rapidly. Filters smooth the final waveform.
Energy becomes heat inside switches, cables, and magnetic components. Resistance and switching activity create losses. Heat matters.
No. Peak efficiency describes controlled conditions, not every operating hour. Light loads, high temperatures, and standby demand can reduce actual output.
Poor ventilation can raise internal temperature quickly. The inverter may limit power to protect its components. Dusty air passages and direct afternoon sunlight can worsen this effect.
Long or thin cables create voltage drops and resistance losses. Higher current makes the losses more noticeable. Short routes and correctly sized conductors usually perform better.
Use input and output power meters at several load levels. Record readings after the inverter reaches a stable temperature. Startup readings may give a misleading impression.
Check weighted efficiency, load curves, voltage range, standby consumption, and thermal derating. Request results at 10%, 25%, 50%, and 100% load. One headline percentage is incomplete.
Keep airflow clear, tighten electrical connections, and reduce unnecessary cable length. Monitor temperature, daily energy, and fault records. Small differences deserve investigation, not instant blame.
Yes. Shading, mismatched strings, dust, and fast cloud changes can move operation away from the best range. The numbers may look clean; field conditions are messier.
No. Meter accuracy, cable temperature, and battery ageing can affect comparisons. I once trusted a peak figure too quickly. Repeated testing is wiser.
Inverter efficiency describes how much of the input electrical energy is successfully delivered as usable output power. Understanding what affects the efficiency of an inverter is important because higher efficiency can reduce energy waste, operating costs, heat generation, and the need for oversized cooling systems. During power conversion, some energy is lost through switching components, resistance in cables and circuits, magnetic components, and heat produced by internal electronics.
Efficiency is influenced by the inverter’s design, component quality, conversion technology, load level, input voltage, temperature, ventilation, and maintenance condition. Many inverters perform best within a specific operating range, while very light or excessive loads may reduce performance. Comparing efficiency should include both peak efficiency and real-world efficiency across different loads and conditions. Proper sizing, adequate airflow, clean connections, stable input power, and regular inspection can help improve long-term performance and ensure that the inverter operates closer to its intended efficiency.

 Sriram Electricals